This Week’s Lessons.
This week, you should watch … well, no lessons, but a few videos: The Big Short, Time Series Data (First 30 Minutes), and Technical Trading.
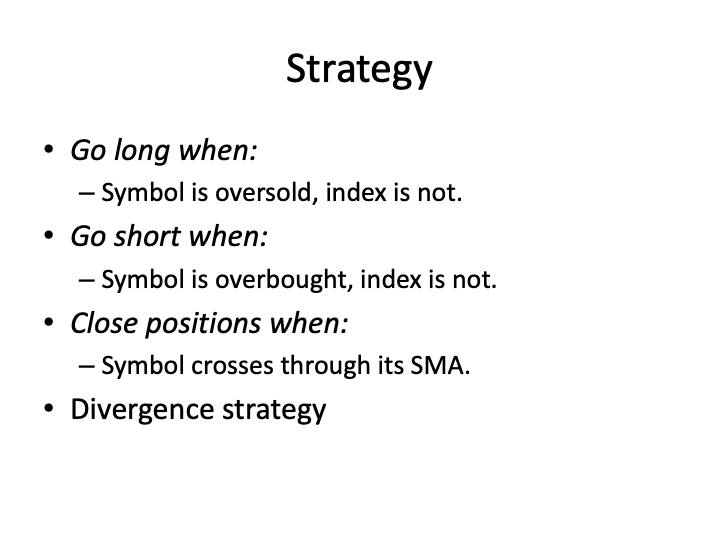
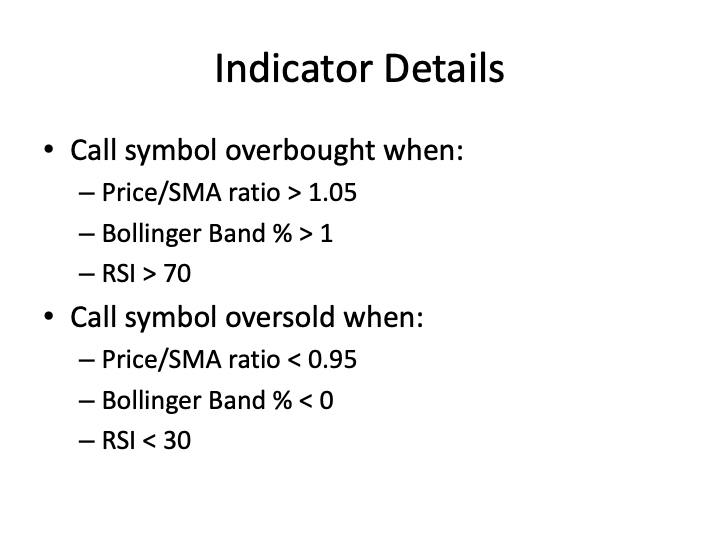
- Slides for Technical Trading
the videos are hosted on Youtube.
Project 5 Video
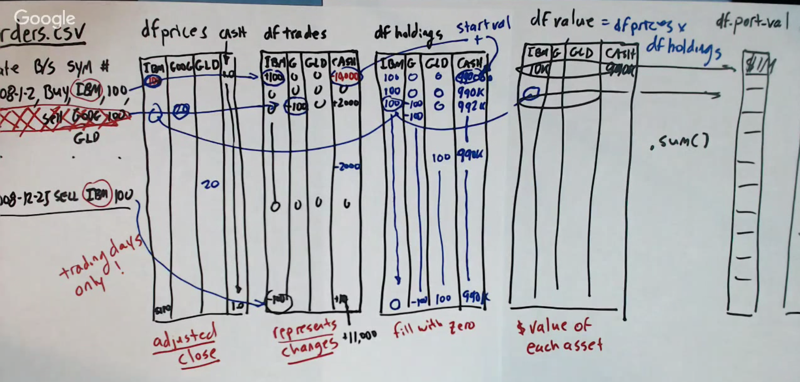
Here is the process to create a market simulator
- construct a df_prices to record the prices (adjusted close price) for each trading day for each stock in the portfolio. Add a cash variable in the data frame and set the value for cash to $1.
- construct df_trades to hold all the tradings. Make sure to get the value of the “cash” column correct.
- df_holdings: the number of stocks and cash for each column.
- df_value: = df_prices * df_holdings.
- df_port_val: = sum of the df_value.
Time Series Data (First 30 Minutes)
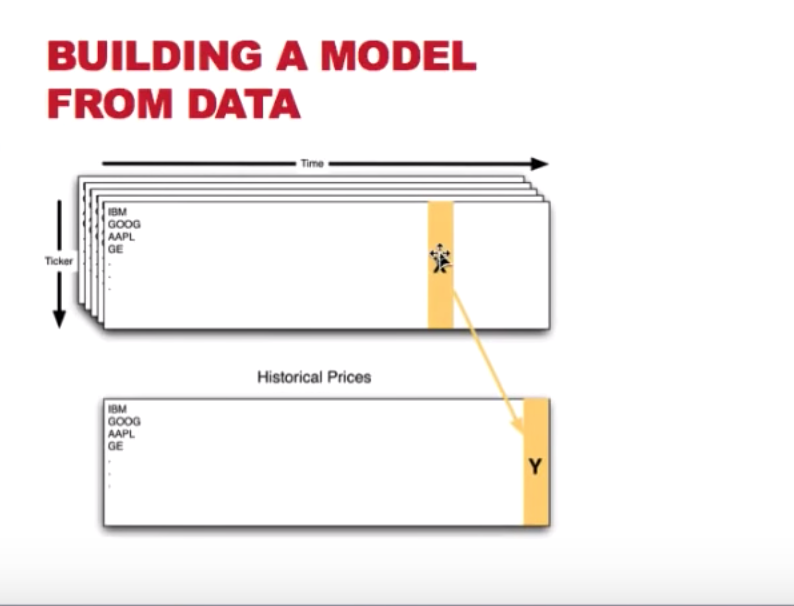
- When using technical indicators to predict stock prices, we usually use X in the indicators to predict the price of several days later.
- To construct a dataset for this, we can pair
Yontand X ont - nto get an X-Y pair for the model building. - usually, we split the data into a training set and a testing data. And the testing data should always be gathered later than the training data
- building model with later data and testing on the former data will bias the result because the “now” is influenced by history.
Backtesting to Validate the Model
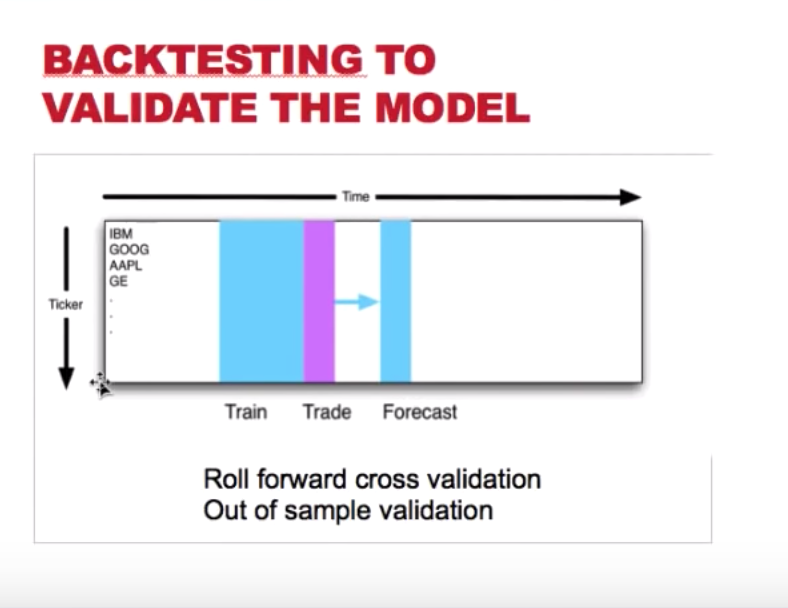
- go back to the beginning of the data, select a chunk of them for training and building the model; Based on that model, make a Forecast towards the future (n days ahead), then make a trade decision.
- Then skip the train and forecast period, select another chunk of data to repeat step 1.
This process is called Roll forward cross validation or Out of sample validation
In this method, we can only use the slice of data in the future for testing. because it is easier to predict past than predict the future
10 Ways that backtest can go wrong.
1. In sample backtesting

- description: train and test the model using the same dataset.
- problem: the in sample error will be small.
- how to avoid: get different dataset for training and testing purpose. e.g. train on 2007 data and testing with 2008+ data.
2. survivor bias
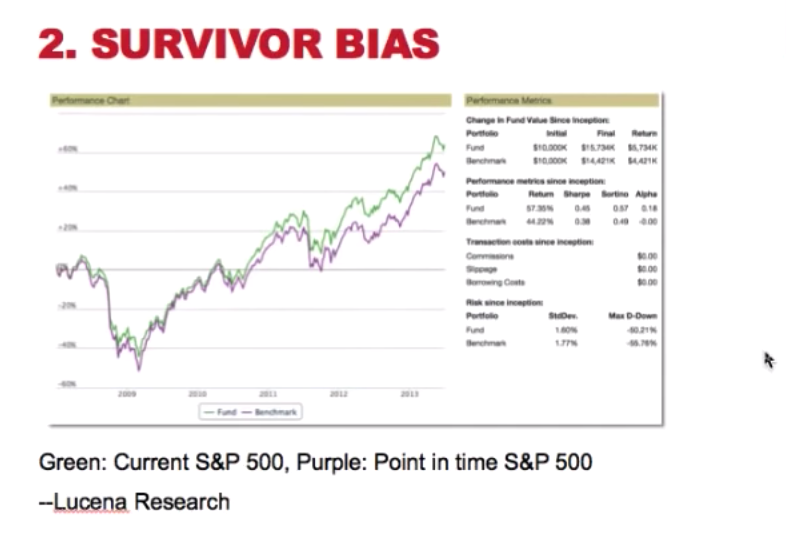
- description: As time goes, participant of an experiment might drop from the study. the final results can only be measured from the participants who are still in the experiment
- problem: as seen in the graph above, the green line, which is the S&P 500 performance with the current members (survivors), the purple line is the S&P 500 using the membership from the beginning of the data. The green line has overestimated the return ( or price of the index).
- how to avoid: 1) use the historical membership; 2) use SBF (survivor bias free) data 3) use the indices as the universe for testing.
3. ignore the market impact
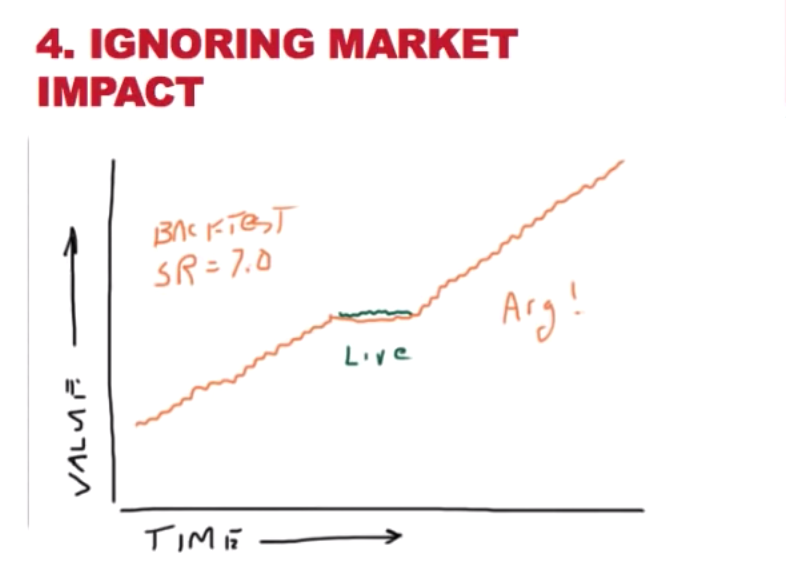
- description: The historical data has no information about your trading. but your trading might affect the price of the stock you trade. Ignoring this will lead to an inaccurate prediction
- problem: When taking action based on a prediction, the stock price at the trading period might affect the performance of the stock because of your live trading.
- how to avoid: include a “slippage” or “market impact” model when back testing.
Case Study in Vectorization of Technical Strategy Python Code
- note: we have the code in project 5 to read in order files and calculate portfolio value.
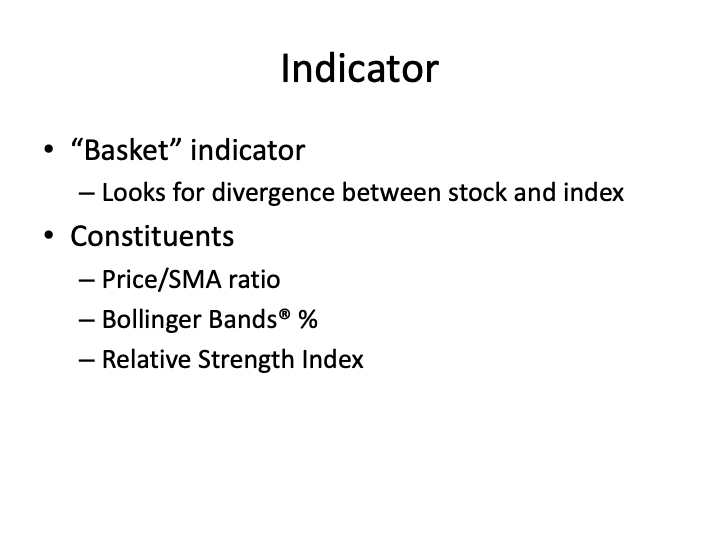
- Relative strength index(wiki) can be used to predict oversold and overbought
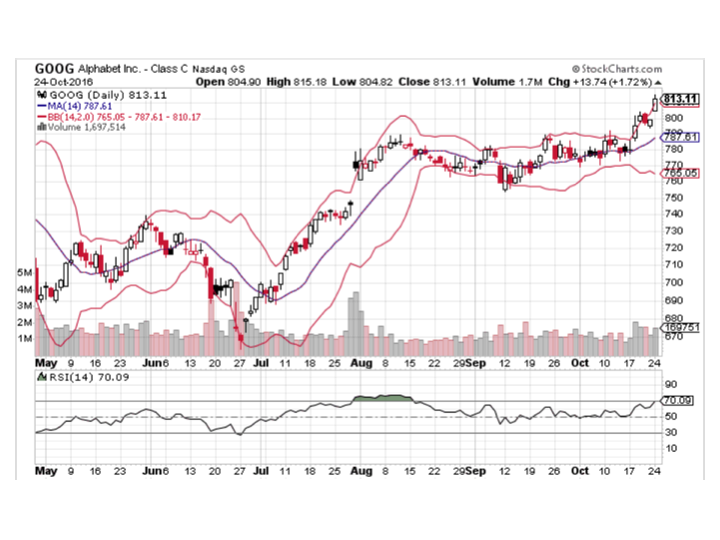 In the graph above, there are
- SMA (the brown line)
- Bollinger Bands ( the red lines)
- Relative strength index ( the black curve below the bar graph)
the easy but slow way of calculating the indicators
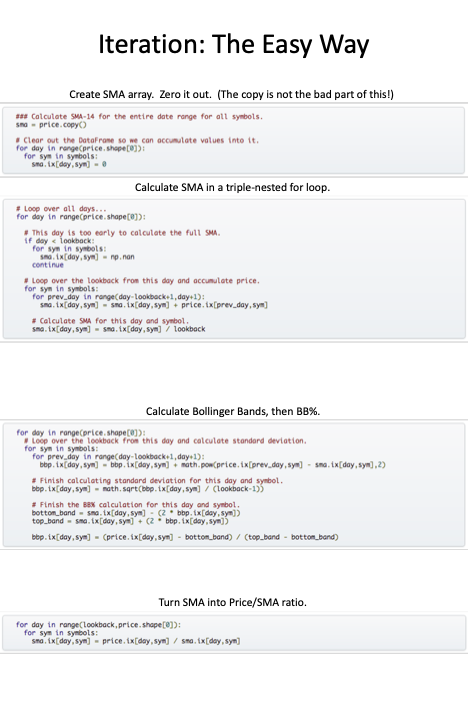
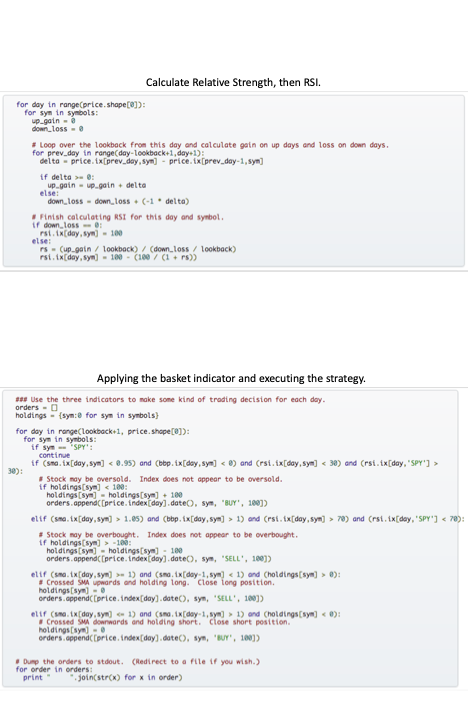
The above method is a correct way of doing the calculation. However, it is very slow to calculate the needed statistics using the method.
real 5m24.461s user 5m24.281s sys 0m0.185s
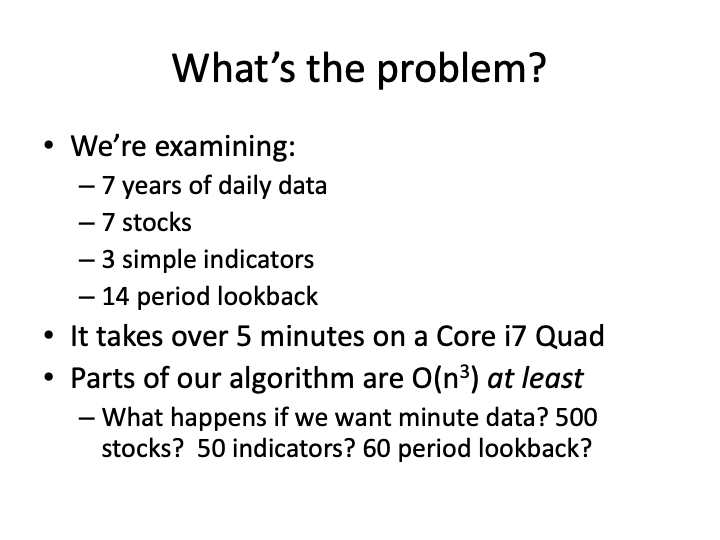
Solution: vectorize the calculation. Here is the PPT used in the video